Fact Sheet

Pennsylvania Public Schools: Nation’s Report Card 2024
Summary
- Despite $4.1 billion in education funding increases over the last four years, Pennsylvania public schools did not rank in the top 10 for any category on the 2024 National Assessment of Educational Progress (NAEP), or Nation’s Report Card.
- The growth of high-needs students is not a defining driver of Pennsylvania’s lackluster performance. Of the states that outpace us, nineteen have larger class sizes, twenty serve more English language learners, seventeen serve student populations where 15 percent or more have disabilities, and twelve serve student populations where 15 percent or more live in poverty.
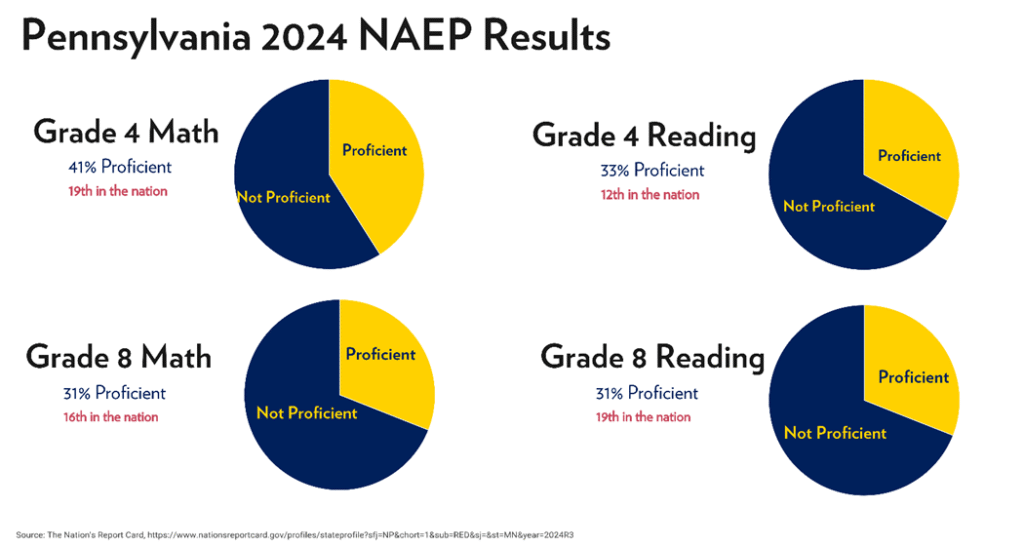
- Less than half of Pennsylvania’s public school fourth-grade students hold proficient scores in both math and reading. For eighth graders, the NAEP results show 69 percent as not proficient in math, and an equal 69 percent cannot read at grade level.
- Moreover, NAEP results show Pennsylvania public schools have made no measurable improvement since 2003 to close achievement gaps of more than 25 points for Black and Hispanic students, Economically Disadvantaged students, or English Language Learners.
- These results raise many red flags given Pennsylvania public schools spent $21,985 per pupil in 2022–23 (latest available data)—the highest in state history and seventh-highest nationally—while serving the smallest number of students in over two decades.
THE NATION’S REPORT CARD
- At the federal level, the Every Student Succeeds Act (ESSA) requires all states to conduct their respective assessments of student achievement.1 Yet, NAEP is a measure that allows educators, policymakers, and the public to see how each state’s students stack up to peers nationwide.2 It offers insight into the success and barriers to student futures when competing with others nationally for college admissions, career placements, and workforce advancement.3
- NAEP, the only ongoing nationwide assessment of state achievement gaps for fourth-, eighth-, and twelfth-graders,4 has kept the integrity of continuous measurement by maintaining its scoring thresholds (i.e., “proficient” means the same thing this year as it did previously).
Pennsylvania Public Schools on the National Stage
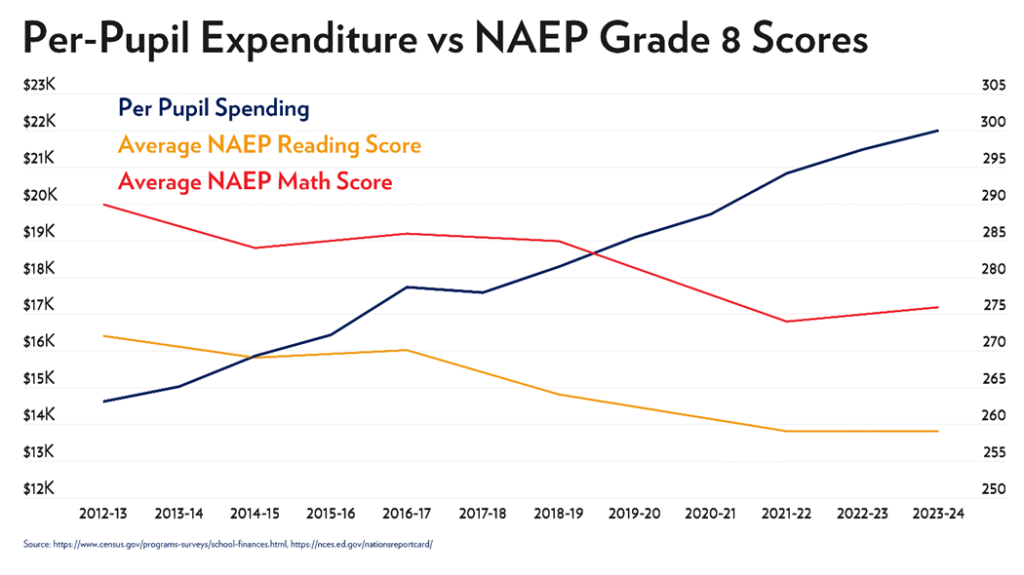
- The latest NAEP results, released in January, reveal that over two-thirds (69 percent) of the commonwealth’s public school eighth graders are not proficient in math and reading. Fourth-grade student proficiency scores are 41 percent in math and 31 percent in reading.5 Pennsylvania’s overall proficiency scores in both grades have stagnated below 50 percent,6 despite year-over-year hikes in state spending for public schools,7 reaching nearly $22,000 per student in 2022–23.8
- NAEP scores represent declines from already-low pre-pandemic performance levels.9 For the Philadelphia school district alone, the results reveal 85 percent of eighth graders as not proficient in math and 82 percent below proficiency in reading.10
- Pennsylvania’s fourth graders once consistently ranked in NAEP’s top 10 for reading achievement—a testament to the state’s commitment to early literacy. Studies show that success in third-grade reading and eighth-grade math are greater predictors of on-time graduation than any other metric.11
- Fewer than half of all Pennsylvania students scored proficient in any grade category. Moreover, Pennsylvania public schools have made no measurable improvement since 2003 when it comes to closing achievement gaps for black and Hispanic students, English Language learners, or economically disadvantaged students.12
- Pennsylvania is not an outlier when it comes to its proportion of high-needs students nationally, among other northeast states, or among states containing the nation’s five largest public-school systems (New York, California, Illinois, California, Florida, and Nevada), according to data from the National Center for Education Statistics (NCES) and the U.S. Census Bureau.
- Of the states that outpace us, nineteen have larger class sizes,13 twenty serve more English language learners,14 seventeen serve student populations where 15 percent or more have disabilities,15 and twelve serve student populations where 15 percent or more live in poverty.16
Resources Versus Results Red Flags
With record resources and the least number of students in over two decades, Pennsylvanians expect more from the commonwealth’s public school system.
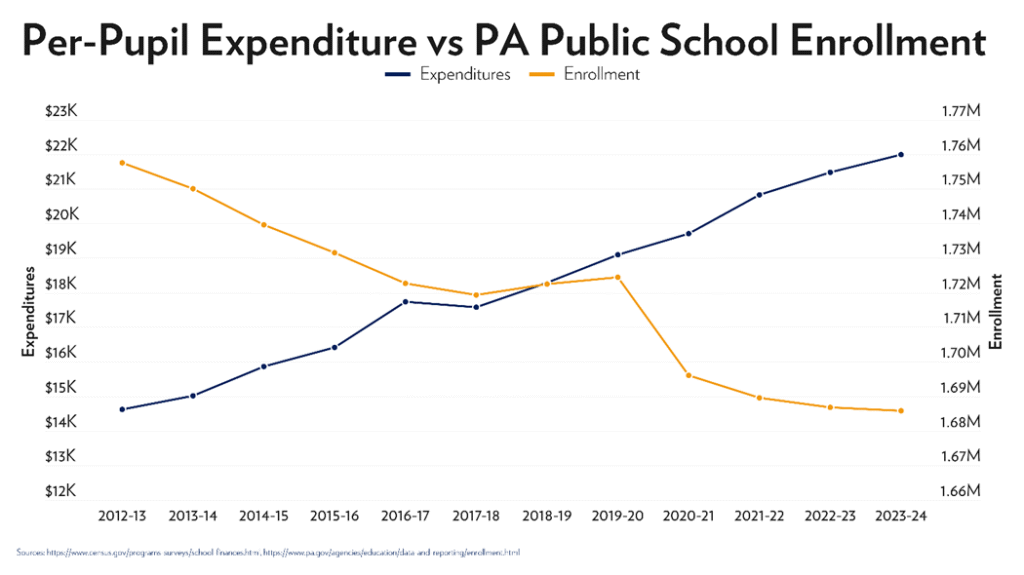
- Enrollment in Pennsylvania K–12 public schools dropped by 140,000 students between 2000 and 2024,17 while in the same years, districts added 24,000 employees.18 And, since 2013, state support for schools has increased 67 percent, reaching $16.8 billion in the 2024–25 budget.19
- More resources for fewer students have not led to higher achievement, indicating Harrisburg should consider options that allow funding to follow the child to the school of their choice.
- Of the 28 studies to date on school choice programs, 25 demonstrated improved outcomes for all students, even those who remained in district public schools. They also save money, increase parental satisfaction, and are associated with academic gains on the NAEP.20
Conclusion
NAEP scores show Pennsylvania’s fourth and eighth-graders did not make the top ten for reading or math. Test scores are not the only measure of student success, nor the only thing parents care about when it comes to their child’s experience at school. However, they are essential tools for knowing where public school students stand on the fundamental skills required to move through each grade level, and to target intervention where and when it is needed.
They are also one of the few measures of public accountability for a system that receives and distributes billions in taxpayer dollars (i.e., one-third of our state’s budget) to serve millions of Pennsylvania citizens during one of the most critical moments in their lives. If nothing else, Pennsylvania’s results on the Nation’s Report Card stand as reminder that more money does not always equate to better results.
The stagnation over the past 10 years, even with historic state increases in financial support and staffing, should serve as a wake-up call to lawmakers and the governor to move forward with legislation that allows funding to follow every student. Establishing the Lifeline Scholarship Program and the Child Learning Investment Tax Credit, as well as the continued expansion of the state’s successful Educational Improvement Tax Credit (EITC) and Opportunity Scholarship Tax Credit (OSTC) programs are fundamental to getting Pennsylvania kids back on track, especially those stuck in low-performing schools.
[1] U.S. Department of Education, “What Is the Every Student Succeeds Act?” January 14, 2025 [revision], https://www.ed.gov/laws-and-policy/laws-preschool-grade-12-education/esea/what-is-the-every-student-succeeds-act.
[2] National Center for Education Statistics, “About NAEP, A Common Measure of Student Achievement,” U.S. Department of Education: Institute of Education Sciences, December 13, 2024 [update], https://nces.ed.gov/nationsreportcard/about/.
[3] NAEP includes private school scores when “at least 70 percent of the schools in the sample participate.” See: National Center for Education Statistics, “Private School NAEP Results Online,” U.S. Department of Education: Institute of Education Sciences, March 28, 2024 [update], https://nces.ed.gov/nationsreportcard/about/private_school_quick_data.aspx#:~:text=NAEP%20assesses%20representative%20samples%20of,schools%20in%20the%20sample%20participate.
[4] Chester E. Finn Jr., “Seven Things to Know about NAEP,” Carnegie Corporation of New York, July 11, 2022, https://www.carnegie.org/our-work/article/seven-things-know-about-naep/#:~:text=The%20National%20Assessment%20of%20Educational%20Progress%20%E2%80%94%20the%20only%20nationally%20representative,the%20Assessment%20of%20Progress%20in.
[5] National Center for Education Statistics, “Results from the 2024 NAEP Reading and Mathematics Assessments at Grades 4 and 8,” U.S. Department of Education: Institute of Education Sciences, January 29, 2025, https://www.nationsreportcard.gov/; National Center for Education Statistics, “Nation’s Report Card: Pennsylvania Overview,” January 29, 2025, https://www.nationsreportcard.gov/profiles/stateprofile/overview/PA?chort=1&sub=MAT&sj=PA&sfj=NP&st=MN&year=2022R3&cti=PgTab_OT&fs=Grade.
[6] National Center for Education Statistics, “Nation’s Report Card: Pennsylvania Overview.”
[7] Commonwealth Foundation, “Deficit Watch: February 2025,” February 5, 2025, https://commonwealthfoundation.org/research/deficit-watch-february-2025/; Commonwealth Foundation, “2025 State of Education Spending in Pennsylvania,” January 22, 2025, https://commonwealthfoundation.org/research/2025-education-spending-pennsylvania/.
[8] Commonwealth Foundation, “Pa. School Funding Reaches $22,000 per Student in 2023,” May 20, 2024, https://www.commonwealthfoundation.org/research/pa-school-funding-22000-student-2023/.
[9] National Center for Education Statistics, “Nation’s Report Card: Pennsylvania Overview.”
[10] National Center for Education Statistics, “Nation’s Report Card: Philadelphia Overview,” U.S. Department of Education: Institute of Education Sciences, January 29, 2025, https://www.nationsreportcard.gov/profiles/districtprofile/overview/XP?sfj=NL&chort=1&sub=MAT&sj=XP&st=MN&year=2024R3&cti=PgTab_OT.
[11] Leila Fiester and Ralph Smith, “Early Warning! Why Reading by the End of Third Grade Matters,” Annie E. Casey Foundation, January 2010, https://www.aecf.org/resources/early-warning-why-reading-by-the-end-of-third-grade-matters; Jia Wang and Pete Goldschmidt, “Importance of Middle School Mathematics on High School Students’ Mathematics Achievement,” Journal of Educational Research 97, No. 1 (September – October, 2003), 3–19, https://www.jstor.org/stable/27542459.
[12] National Center for Education Statistics, “Nation’s Report Card: 2024 Mathematics State Snapshot Report, Pennsylvania, Grade 4, Public Schools,” U.S Department of Education: Institute of Education Sciences, January 29, 2025, https://nces.ed.gov/nationsreportcard/subject/publications/stt2024/pdf/2024219PA4.pdf.
[13] National Center for Education Statistics, “Common Core of Data: America’s Public Schools (Table 2. Number of operating public elementary and secondary schools and districts, student membership, teachers, and pupil/teacher ratio, by state or jurisdiction: School year 2022–23),” U.S Department of Education: Institute of Education Sciences, accessed January 31, 2025, https://nces.ed.gov/ccd/tables/202223_summary_2.asp.
[14] National Center for Education Statistics, “Digest of Education Statistics (Table 204.20. English learners (ELs) enrolled in public elementary and secondary schools, by state or jurisdiction: Fall 2011 through fall 2021),” U.S. Department of Education: Institute of Education Sciences, 2023, https://nces.ed.gov/programs/digest/d23/tables/dt23_204.20.asp.
[15] National Center for Education Statistics, “ Students with Disabilities,” U.S. Department of Education: Institute of Education Sciences, May 2024 [update], https://nces.ed.gov/programs/coe/indicator/cgg/students-with-disabilities.
[16] U.S. Census Bureau, “Small Area Income and Poverty Estimates (SAIPE) Program,” accessed February 3, 2025, https://www.census.gov/programs-surveys/saipe.html.
[17] Commonwealth Foundation, “2025 State of Education Spending”; Pennsylvania Department of Education, Public School Enrollment Reports, August 13, 2024, https://www.education.pa.gov/DataAndReporting/Enrollment/Pages/PublicSchEnrReports.aspx.
[18] Commonwealth Foundation, “2025 State of Education Spending”; Pennsylvania Department of Education, Professional and Support Personnel, Professional Staff Summary Reports and Public School Support Personnel Reports, accessed January 31, 2024, https://www.education.pa.gov/DataAndReporting/ProfSupPers/Pages/ProfStaffSummary.aspx.
[19] Commonwealth Foundation, “2025 State of Education Spending”; Commonwealth Foundation, “Deficit Watch: February 2025.”
[20] EdChoice, “EdChoice Study Guide: A Review of the Research on Private School Choice,” 2022, https://files.eric.ed.gov/fulltext/ED625416.pdf#page=3.