Fact Sheet
Pennsylvania Education Myths
Summary
Conversations about education in Pennsylvania are fraught with myths, including the notions that Pennsylvania public schools remain underfunded, nonpublic options and school choice programs lack accountability, private schools only serve the rich, and choice adversely impacts vulnerable students. This fact sheet addresses these and other common myths.
MYTH:Pennsylvania is a leader on the national stage in education quality.
FACT:Pennsylvania leads in spending, ranking seventh nationwide in state per-pupil funding.[1] Yet, Pennsylvania failed to make the top 10 for any category on the 2024 National Assessment of Educational Progress (NAEP), or the Nation’s Report Card.[2]
- NAEP is a nationwide measure of student achievement. The 2024 results, released in January, reveal over two-thirds (69 percent) of the commonwealth’s public school eighth graders are not proficient in math and reading. Fourth-grade student proficiency scores are 41 percent in math and 31 percent in reading.[3] Pennsylvania’s overall proficiency scores in both grades have stagnated below 50 percent despite the year-over-year hikes in state spending, $4.1 billion in the last four years.[4]
- State-level testing echoes the difficulties. The 2024 Pennsylvania System of School Assessment (PSSA) results show about half of fourth and eighth graders cannot read at grade level. Math scores reveal only 28.5 percent of eighth graders and 48.6 percent of fourth graders as proficient.[5]
MYTH:Pennsylvania public schools remain underfunded.
FACT:Pennsylvania public schools have more resources than ever before, with state support of public schools reaching an all-time high of $16.8 billion in 2024–25.[6]
- Overall, school district revenues reached $37 billion in 2022–23, or $22,000 per student. The commonwealth spends $4,100 more than the national average.
- Meanwhile, school district enrollment has declined by nearly 300,000 over two decades; the Pennsylvania Department of Education (PDE) expects enrollment to decline by another 60,000 students by 2028.[7] Increased spending has not led to better results.
MYTH:Public schools assigned by zip code meet all students’ needs.
FACT:Pennsylvania families need choices beyond the traditional public school.
- Pennsylvania has more than 500,000 students. Almost 30 percent receive their education outside their district-assigned school setting: 242,000 attend private/nonpublic schools, 164,000 attend charter schools, nearly 66,000 attend a career/technical school, while 44,000 are homeschooled.[8] Thousands more attend magnet schools.
- According to a Commonwealth Foundation poll, fewer than one in five Pennsylvania parents would choose a public district school for their child if cost were not an obstacle.[9] More than half would choose some form of private school.
- Nearly 212,000 students remain trapped in failing, “low-achieving” public schools—which PDE defines as schools in the bottom 15 percent based on PSSA and Keystone test scores.[10]
MYTH:Private Schools do not serve high-need students.
FACT:Pennsylvania has over 3,000 private and nonpublic schools, of which many are designed to serve students with even severe disabilities.
- Notably, 133 of Pennsylvania’s private schools serve student populations where 20 percent or more come from low-income backgrounds, and 45 serve student populations where 90 percent or more come from low-income backgrounds.[11]
- There are over 35 private schools for the deaf and blind across the state.[12] There are private schools for students with dyslexia, autism, and cerebral palsy; wheelchair-bound students; and students with other disabilities.
- Pennsylvania students with disabilities whose public school cannot meet their needs are placed in a private school at the expense of the public school. For example, in 2023–24, the School District of Philadelphia spent $35.3 million to send 682 students with special needs to 56 private schools.
- High-need students in the commonwealth’s public schools face 25-point achievement gaps from their peers, according to data collected by the National Center of Education Statistics (NCES). Of the states who outranked Pennsylvania on the NAEP, nineteen have larger class sizes,[13] twenty serve more English language learners,[14] seventeen serve student populations where 15 percent or more have disabilities,[15] and twelve serve student populations where 15 percent or more live in poverty.[16]
MYTH:School choice serves the rich and diverts resources from public schools.
FACT:School choice is already available to parents who can afford a home in a high-achieving public school district.
- Low-income families deserve the same access to quality schools as wealthy families.
- The primary form of educational choice in Pennsylvania is “choice by mortgage.” That is, higher-income families move to zones with better-quality schools. District boundaries, or redlining, separate these schools from neighboring districts and discriminate against low-income parents.
- Zip codes (i.e., the home families can afford) decide which public school students must attend. This leaves over 200,000 Pennsylvania students trapped in failing public schools.
- Pennsylvania’s Educational Improvement Tax Credit (EITC) and Opportunity Scholarship Tax Credit (OSTC) programs provide tuition scholarships to low-income families earning between $41,000 and $73,000 annually. Additionally, OSTC scholarships are only available to students residing in low-achieving public schools.[17]
- Data from the Archdiocese of Philadelphia shows most families receiving tax credit scholarships earn below the median income in their respective counties.
MYTH:Educational choice programs harm Pennsylvania’s public schools.
FACT:Educational choice benefits all students and families.
- School choice programs, like Pennsylvania’s EITC and OSTC, receive funding via tax credits or separate appropriations and do not impact existing public school funding. In fact, Gov. Josh Shapiro proposes to push public school spending to $17.7 billion in 2025–26,[18] at over $22,000 per student, while school choice programs educate students for $2,600–$10,000 per student for a total of $525 million.
- The Lifeline Scholarship Program would benefit students in Pennsylvania’s lowest-achieving public schools, allowing families to choose the school that best meets their child’s needs. Public schools would retain current funding regardless of Lifeline Scholarships.
- Lifeline Scholarships would offer a restricted-use Education Savings Account (ESA) to any student assigned to a school ranked in the bottom 15 percent of performance.[19] The ESA funds would be for “qualified education expenses,” which include tuition, school-related fees, and special education services fees associated with attendance at a nonpublic school.[20]
- At a cap of $300 million, approximately 39,000 students would receive Lifeline Scholarships. Fewer than 15 percent (212,000) of Pennsylvania’s 1.6 million K–12 students would receive tuition scholarships with this cap limit.
MYTH:Educational choice programs only benefit those who participate.
FACT:Educational choice benefits all students and schools in the district.
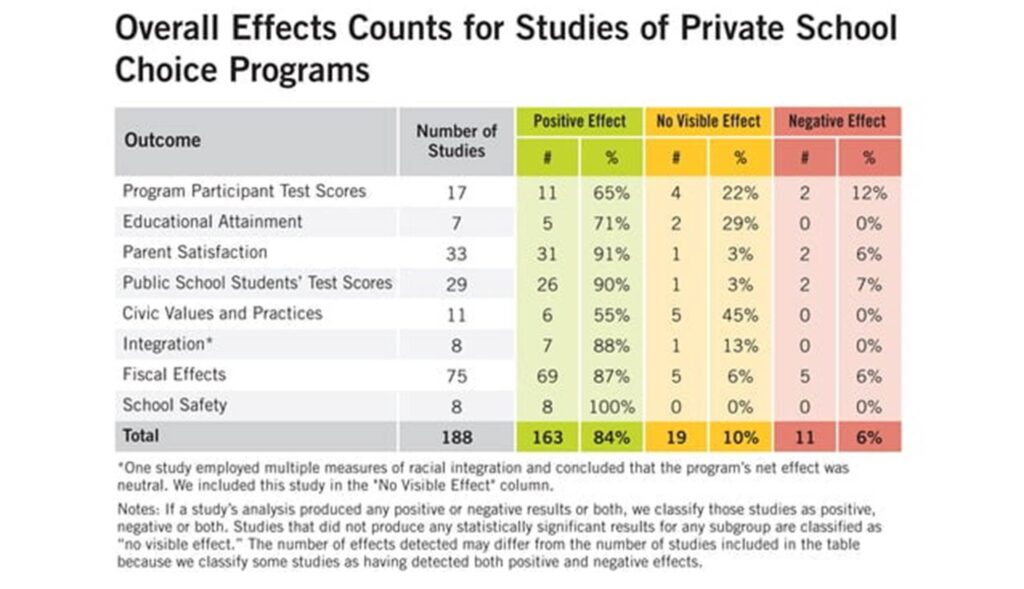
- Because public school funding increases from year to year, regardless of fluctuations in student enrollment, students who choose to remain in district schools would benefit from annual per-pupil funding increases, smaller class sizes, smaller student-to-teacher ratios, and improved access to resources. According to an EdChoice review of 75 studies on the fiscal effects of school choice programs, 87 percent found positive impacts when it comes to savings for school districts.[21]
- Of the 53 studies on the academic impacts of school choice programs (i.e., Program Participant Test Scores, Educational Attainment, and Public School Student Test Scores), 42 found improved test score outcomes for all students, even those who remained in district schools. Moreover, choice programs save money for school districts and taxpayers, increase parental satisfaction, and are associated with academic gains on the NAEP.[22]
MYTH:School choice programs and nonpublic schools lack accountability.
FACT:Nonpublic schools have the ultimate form of accountability: Parental satisfaction.
- Students and families choose to be there and can leave anytime. When private schools lose students, they lose funds. When public schools lose students, they gain funds. Pennsylvania’s “hold harmless” provisions guarantee districts the same amount of baseline funding as that received in the year prior plus a percentage, regardless of changes in enrollment.[23]
- Several public schools have zero students proficient in reading or math, yet these schools receive regular increases in state and local tax dollars. That is not “accountability” by any definition of the term.
- Many private schools utilize a variety of reliable standardized tests. Those like the Renaissance STAR assessment platform, iReady, DIBELS early literacy assessments, and more are utilized by nonpublic schools, providing comprehensive data on where students stand on grade-level skills.
[1] Commonwealth Foundation, “Pa. School Funding Reaches $22,000 per Student in 2023,” May 20, 2024, https://commonwealthfoundation.org/research/pa-school-funding-22000-student-2023/#:~:text=Pennsylvania%20spending%20per%20student%20ranks,latest%20available%20data%20from%202022).
[2] National Center for Education Statistics, “National Assessment of Educational Progress: How Is Your State Performing?” U.S.
Department of Education: Institute of Education Sciences, February 7, 2025 [update], https://nces.ed.gov/nationsreportcard/state/.
[3] National Center for Education Statistics, “Results from the 2024 NAEP Reading and Mathematics Assessments at Grades 4 and 8,” U.S. Department of Education: Institute of Education Sciences, January 29, 2025, https://www.nationsreportcard.gov/.
[4] National Center for Education Statistics, “Nation’s Report Card: Pennsylvania Overview,” January 29, 2025, https://www.nationsreportcard.gov/profiles/stateprofile/overview/PA?chort=1&sub=MAT&sj=PA&sfj=NP&st=MN&year=2022R3&cti=PgTab_OT&fs=Grade.
[5] Pennsylvania Department of Education, “Assessment Reporting: 2024 PSSA English Language Results, 2024 PSSA Math Results,” https://www.pa.gov/agencies/education/data-and-reporting/assessment-reporting.html.
[6] Commonwealth Foundation, “2025 State of Education Spending in Pennsylvania,” January 22, 2025, https://commonwealthfoundation.org/research/2025-education-spending-pennsylvania/; Commonwealth Foundation, “2024–25 State Budget Analysis,” July 12, 2024, https://www.commonwealthfoundation.org/research/2024-25-pa-state-budget-analysis/.
[7] Pennsylvania Department of Education, “Enrollment Reports and Projections: 2023–25 School District Enrollment Projections,” September 19, 2024, https://www.pa.gov/agencies/education/data-and-reporting/enrollment.html#accordion-cb5f3bee47-item-d39065aaf4.
[8] Pennsylvania Department of Education, “Public School Enrollment Reports,” “Private and Non-Public Schools Enrollment Reports,” and “Home School Education,” accessed February 25, 2025, https://www.pa.gov/agencies/education/data-and-reporting/enrollment.html#accordion-cb5f3bee47-item-0c8821a505.
[9] Commonwealth Foundation, “Common Ground in the Commonwealth Q4 Survey,” December 2023, https://www.commonwealthfoundation.org/wp-content/uploads/2023/12/Common-Ground-in-the-Commonwealth-Q4-Survey-Analysis-FINAL-1.pdf.
[10] Pennsylvania Department of Education, “Opportunity Scholarship Tax Credit Program (OSTCP),” accessed February 25, 2025,
[11] Pennsylvania Department of Education, “Private and Non-Public Schools Enrollment Reports.”
[12] Pennsylvania Department of Education, “Directory of Approved Private Schools and Chartered Schools for the Deaf and the Blind,” May 2021, https://www.pattan.net/assets/PaTTAN/9e/9e222828-ca01-4285-bbd6-d666ebb01ed6.pdf#page=3.
[13] National Center for Education Statistics, “Common Core of Data: America’s Public Schools (Table 2. Number of operating public elementary
and secondary schools and districts, student membership, teachers, and pupil/teacher ratio, by state or jurisdiction: School year 2022–23),”
U.S Department of Education: Institute of Education Sciences, accessed January 31, 2025, https://nces.ed.gov/ccd/tables/202223_summary_2.asp.
[14] National Center for Education Statistics, “Digest of Education Statistics (Table 204.20. English learners (ELs) enrolled in public elementary
and secondary schools, by state or jurisdiction: Fall 2011 through fall 2021),” U.S. Department of Education: Institute of Education Sciences,
2023, https://nces.ed.gov/programs/digest/d23/tables/dt23_204.20.asp.
[15] National Center for Education Statistics, “Students with Disabilities,” U.S. Department of Education: Institute of Education Sciences, May
2024 [update], https://nces.ed.gov/programs/coe/indicator/cgg/students-with-disabilities.
[16] U.S. Census Bureau, “Small Area Income and Poverty Estimates (SAIPE) Program,” accessed February 3, 2025,
https://www.census.gov/programs-surveys/saipe.html; U.S. Census Bureau, “SAIPE State and County Estimates for 2023,” December 2023, https://www.census.gov/data/datasets/2023/demo/saipe/2023-state-and-county.html.
[17] Commonwealth Foundation, “Record Tax Credit Scholarship Waiting List Shows Growing Demand for Education Options,” February 26, 2025, https://commonwealthfoundation.org/research/tax-credit-scholarship-waiting-list/.
[18] Nathan Benefield, “Governor Shapiro’s 2025 Budget Proposal: An Extreme Spending Binge,” Commonwealth Foundation, February 4, 2025, https://commonwealthfoundation.org/research/shapiro-2025-budget-proposal/.
[19] The state Senate passed Lifeline Scholarships, codified as the Pennsylvania Award for Student Success (PASS), multiple times during the 2023–24 session. However, Gov. Josh Shapiro, despite repeated endorsements and referring to Lifeline as “unfinished business,” vetoed the program from the 2023–24 budget, and the House excluded it from the 2024–25 budget deal. See Marc Levy, “Shapiro Says Unfinished Business Includes Vouchers, More School Funding and Higher Minimum Wage,” Associated Press, November 21, 2023, https://www.abc27.com/news/top-stories/shapiro-says-unfinished-business-includes-vouchers-more-school-funding-and-higher-minimum-wage/; Commonwealth Foundation, “Underserved Students Face Uncertain Future Following Gov. Shapiro’s Budget Decision,” news release, August 3, 2023, https://commonwealthfoundation.org/2023/08/03/shapiro-budget-decision/; Commonwealth Foundation, “2024–25 State Budget Analysis,” July 12, 2024, https://www.commonwealthfoundation.org/research/2024-25-pa-state-budget-analysis/.
[20] Commonwealth Foundation, “Lifeline Scholarship Program/PASS,” January 30, 2024, https://commonwealthfoundation.org/research/lifeline-scholarship-program-pass/; Commonwealth Foundation, “Lifeline and Education Choice Myths and Facts,” January 4, 2024, https://commonwealthfoundation.org/research/lifeline-education-choice-myths-facts/.
[21] Martin F. Lueken, “Fiscal Effects of School Choice,” EdChoice, October 2024, https://www.edchoice.org/research-library/?report=2024-fiscal-effects-of-school-choice#report.
[22] Lueken, “Fiscal Effects of School Choice.”
[23] Commonwealth Foundation, “Education Funding in the Commonwealth,” January 10, 2024, https://commonwealthfoundation.org/research/education-funding-commonwealth/; James Paul, “Harmed by ‘Hold Harmless,’” Commonwealth Foundation, December 15, 2014, https://commonwealthfoundation.org/2014/12/15/harmed-by-hold-harmless/.