Stay Informed
"*" indicates required fields
Blog

New Philly Schools Report Shows Increased Spending on Staff, Declining Enrollment, and Worse Academic Outcomes
In March, with no fanfare, the School District of Philadelphia posted its Comprehensive Annual Financial Report (CAFR). The new report shows that, despite record-level spending, district students haven’t improved academically.
After reviewing the nearly 200-page document, we uncovered some alarming numbers and trends over the past decade.
More Staff, Fewer Students
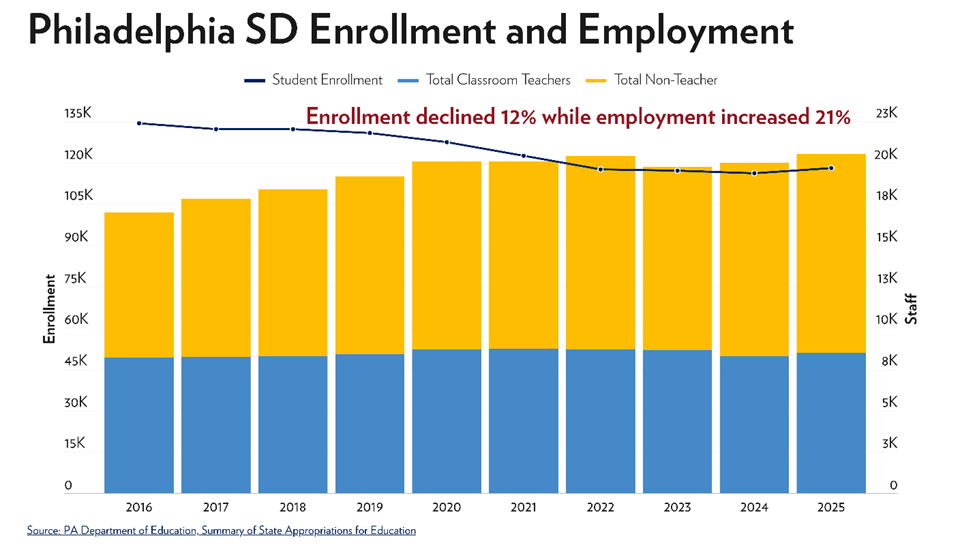
Philadelphia schools’ employment and enrollment have trended in opposite directions.
The district workforce has grown considerably over the last decade, up by 21 percent since 2016.
And this growth has disproportionately favored non-teaching staff. Philadelphia schools employ 4 percent more teachers than they did in 2016, but administrative positions have grown by 56 percent, according to page 173 of the report. Since 2016, the district has added 2,125 non-instructional employees, excluding teachers and other classroom-based instructors, such as paraprofessionals, counselors, etc.
With more than 20,500 employees, the district is one of the largest employers in the city. The district employs more workers than other major Philadelphia-area employers, such as Temple University, Comcast, the Southeastern Transportation Authority, and Drexel University (see page 172).
Despite hiring more employees, the district continues to enroll fewer students. According to page 174, total non-charter student enrollment has dropped from 134,227 in 2016 to 117,956 in 2025—a 12 percent decrease. Due to this drop in enrollment, class sizes have also shrunk, from 16.4 students per teacher in 2016 to only 13.9 in 2025.
Fewer Students, More Spending
Despite the decrease in enrollment, per-pupil spending has grown dramatically in Philadelphia.
The CAFR shows two numbers for per-student spending: $28,736 and $42,621.
A more accurate figure takes total spending, excludes payments to charter schools, and divides by the number of district students. We can also calculate the per-student payments to charter schools by using the excluded numbers.
On page 43, the CAFR lists $5,411,531,347 in total governmental spending by the district. This total represents a 78 percent increase since 2016.
The district paid $1,524,598,000 in charter school tuition in 2025. In addition, the district spent an estimated $97,926,441 on charter student transportation.
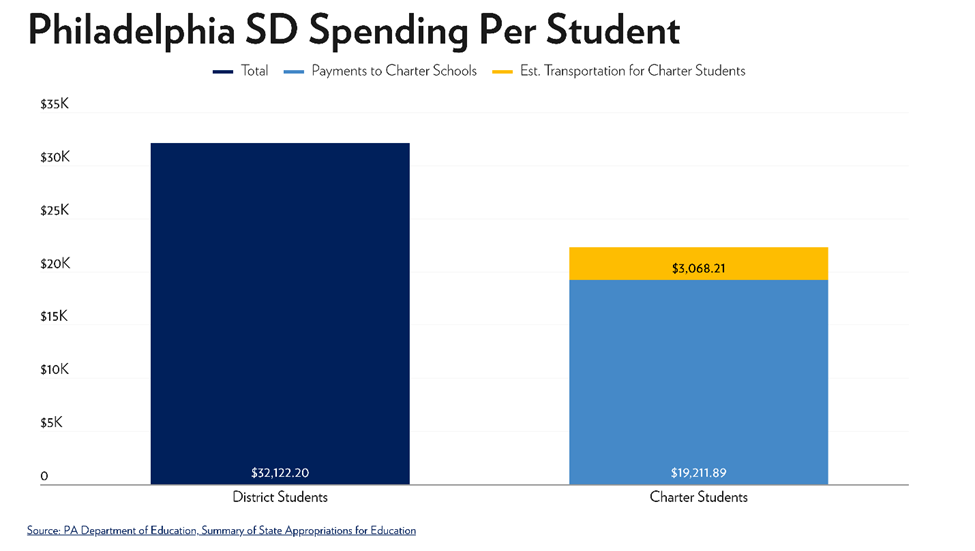
Excluding charter expenses, the districts’ total expenditures in direct spending were $3,789,006,559 in 2025. With 117,956 students enrolled in district-run schools, that represents $32,122 per student—about $9,000 more than the state average.
This per-pupil rate far exceeds what the district spent in the past. Using the same equation, the district spent $17,040 per student in 2016—about half of what it spent in 2025.
Additionally, we can see that the average payment to charter schools—for the 79,357 charter students—represents $19,211 per student. That is, charter schools received, on average, only 60 cents for every dollar the district spent. (The district also spent an estimated $3,000 in transportation costs per charter student).
More Spending, No Academic Gains
This CAFR report is missing one key detail: the return on investment. Despite this huge influx in spending, Philadelphia students haven’t improved academically.
The Pennsylvania System of School Assessment (PSSA) scores highlight this lack of academic achievement. In 2016, less than one-third of Philly students tested proficient and above in English Language Arts (ELA). Math scores were even worse, with only 17.5 percent of students demonstrating proficiency.
Fast forward to 2025, and the picture didn’t change much. Philly students tested about the same for ELA: 33 percent proficient and above. Math scores improved slightly, with about one-quarter of Philly students demonstrating proficiency.
Chronic absenteeism—where students miss 10 percent or more of the school year—also remains a problem. In 2016, 32 percent of Philadelphia students missed 18 or more days, nearly double the national average. Again, that number remained roughly the same in 2025, with one in three students categorized as chronically absent. This issue is even more profound at the school level, with rates reaching 70 percent in some Philadelphia high schools.
More Choice is the Answer
Taken together, these trends should raise suspicions about the district’s frequent claims about underfunding.
Over a decade, the district spent almost twice as much per student and yielded virtually no academic improvements. If significantly more money and personnel haven’t translated into better performance, simply increasing funding is unlikely to solve the district’s challenges.
Philadelphia students and taxpayers deserve better. Kids deserve a high-quality education, and taxpayers should expect better stewardship of their dollars.
Educational choice can provide both. Growing educational alternatives—either by expanding the charter school inventory or by providing scholarships for private schools—would empower students and families to find better schools. The Children’s Scholarship Fund of Philadelphia (CFSP) found that about 70 percent of their recipients, who used their scholarships to attend private schools, live in neighborhoods with schools designated by Pennsylvania as “low-achieving.” CFSP also found that these scholarship recipients outperformed their public school counterparts academically.
The district’s own data tells a damning story. More staff and nearly double the spending have produced little to no improvement in student outcomes. Hiding the numbers doesn’t change them, and continuing the same approach won’t either. If the Philadelphia school district is serious about results, it must prioritize accountability and expand educational options that are already delivering for families.
Topics on this page
Connect With Us
Email Sign Up
"*" indicates required fields