Fact Sheet

Tax Credit Scholarship Myths and Facts
Summary
Pennsylvania’s tax credit scholarship programs, the Educational Improvement Tax Credit (EITC) and the Opportunity Scholarship Tax Credit (OSTC), provide more than 100,000 scholarships annually to low- and middle-income K–12 students attending non-public schools across all 67 counties.
Beginning in 2027, the Federal Scholarship Tax Credit (FSTC) will provide tax credit scholarships to K–12 students living in states that opt in to the program. Gov. Josh Shapiro must “voluntarily elect” to join the program by January 1, 2027, for Pennsylvania students to benefit from the program’s onset.[1]
This fact sheet addresses the most common myths surrounding tax credit scholarships.
Pennsylvania’s EITC and OSTC Scholarship Programs
MYTH: Tax credit scholarships lack accountability.
FACT: Parental satisfaction is the ultimate form of accountability.
- Private schools are accountable to parents and stand to lose tuition dollars when parents are unhappy with academic outcomes.
- While funding for Pennsylvania public schools jumped to almost $24,000 per student in the 2024–25 school year,[2] more money has not improved student outcomes. Despite the 68 percent spending increase since 2015, the Pennsylvania System of School Assessment (PSSA) 2025 results reveal that 51.5 percent of kids read below grade level, and in math, 58.3 percent score below basic or basic.[3]
- The latest National Assessment of Educational Progress (NAEP), or Nation’s Report Card, results released in January 2025, underline that Pennsylvania public schools have made no measurable improvement since 2003 to close achievement gaps of more than 25 points for Black and Hispanic students, economically disadvantaged students, or English language learners.[4]
- The lack of accountability is especially evident among the state’s low-achieving public schools. Public schools that repeatedly score in the bottom 15 percent on Keystone and PSSA exams have received increased education funding, all without producing academic results.
- There are 211,000 kids across the state attending 380 low-achieving district schools. Sixty-six percent (or 250) of these schools have, for seven or more years, been among Pennsylvania’s low-achieving schools, with kids trapped in a failing school for their entire elementary, middle, or high school tenure.
- The School District of Philadelphia, at 134, has the highest number of low-achieving schools.[5]
MYTH: Tax credit scholarships serve mostly white and wealthy students.
FACT: EITC and OSTC tax credit scholarships serve families of all races who earn below the median income for Pennsylvania.
- EITC scholarship recipients are racially diverse. Over one-third (42 percent) of students identify as a person of color, compared with the general population in Pennsylvania, where 80 percent of residents are white.
- EITC and OSTC tax credit scholarship programs serve families with incomes between $44,000 and $78,081 per year, well below Pennsylvania’s median family income of $100,557.[6]
MYTH: Tax credit scholarships take money away from public schools.
FACT: Tax credit scholarships do not reduce public school funding; rather, business and private donors provide all award funding.
- Pennsylvania’s tax credit scholarship programs are separate from public school spending.
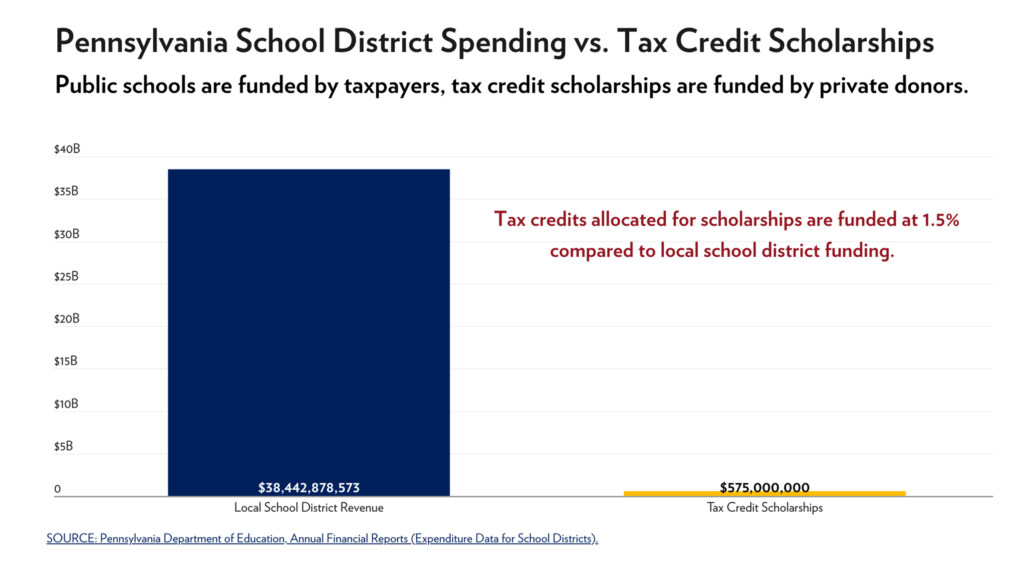
- The 2025–26 state budget includes $17.7 billion of taxpayer dollars for public schools. In contrast, the same budget has capped tax credits for K-12 scholarships at $575.[7]
- In total, school districts received more than $38 billion from federal, state, and local taxpayers in 2024-25.
- Scholarship funds come from businesses and private donors who donate directly to scholarship organizations, including Education Improvement Organizations (EIOs), and receive a Pennsylvania tax credit of between 75 and 90 percent of their scholarship donation.
MYTH: Pennsylvania already has enough school choice.
FACT: Parent demand for tax credit scholarships far exceeds supply.
- Pennsylvania families want and need more options beyond the traditional public school.
- Every year, EITC and OSTC applications outnumber scholarships, leaving thousands of kids behind.
- Tax credit limits, set each year by state lawmakers, fail to address rising demand. For the 2023–24 school year (most recent data available), despite a record 101,751 scholarship awards throughout the commonwealth’s 67 counties, caps turned away 40 percent, or 68,817 student applications.[8]
- June 2026 polling by the Commonwealth Foundation shows nearly three out of four (74 percent) Pennsylvanians support expanding tax credit scholarships.[9]
MYTH: Private and religious schools deny enrollment to special education students.
FACT: EITC and OSTC scholarships empower families to choose a school that best serves their child’s needs and circumstances, rather than being forced to attend a district school assigned to their home address.
- Private schools can and do educate public school students using Pennsylvania tax dollars.
- When a school district cannot meet a student’s special education needs, federal, state, and district funding provide tuition scholarships for special education students to attend private schools.[10]
- In 2023–24, school districts paid for 8,447 special needs students to receive their education at non-district schools, at a cost of $372 million, according to Right to Know requests.
- The Philadelphia School District outsourced learning for nearly 700 special education students at a cost of more than $35 million.
- School districts discriminate against students based on geography. The refusal of school districts to enroll children who live outside the geographic boundaries of schools limits educational opportunity and harms low-income families the most.
MYTH: Private and religious schools discriminate against and refuse to enroll students for any reason, including disability, race, socio-economic status, or sexual orientation.
FACT: Tax credit scholarships provide students the opportunity to find a school that best meets their needs, regardless of ability, race, socio-economic status, or sexual orientation.
- Parents choosing a school that aligns with their family’s values is not discrimination; it is empowerment. Parents know which school is best for their kids.
- Pennsylvania offers a diverse array of over 2,000 private schools that align with the values of Pennsylvania families. From schools for the Amish, Catholic, Christian, Jewish, Muslim, and Quaker faiths, to LGBTQ+ friendly, secular, and those serving special education students, Pennsylvania private schools offer something for everyone. Tax credit scholarships put these schools within reach of the commonwealth’s most socially and economically at-risk children.
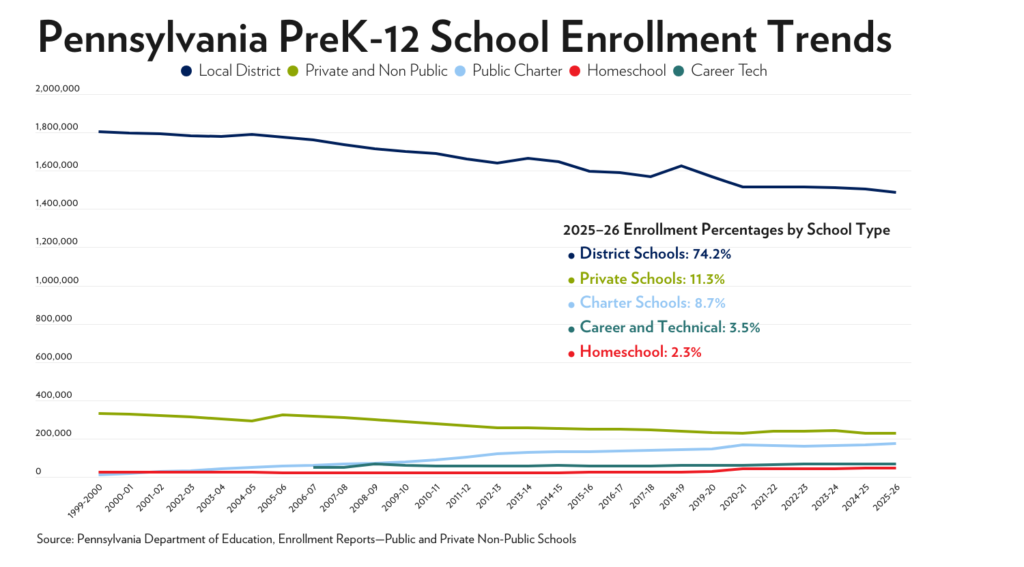
- Almost 30 percent of Pennsylvania’s K–12 students attend a school that aligns with their family’s values.
- During the 2024–25 school year, over 500,000 students received their education outside of their district-assigned school: 226,000 in private/non-public schools, 169,000 in charter schools, nearly 68,000 in career/technical schools, and 53,000 through homeschooling.[11]
MYTH: Pennsylvania’s public schools are underfunded.
FACT: Pennsylvania spends a historic $23,870 per student, whereas the average private school tuition in Pennsylvania is $14,846.[12]
- Pennsylvania ranks tenth nationally for public school spending per student.
- The pro-public school advocacy group Education Law Center gave Pennsylvania an “A” (Above Average) for education funding in its 2025 report, debunking the public school underfunding myth.[13]
Federal Scholarship Tax Credit
MYTH: The FSTC program lacks accountability.
FACT: Parental satisfaction is the ultimate form of accountability.
- Private schools are accountable to parents and stand to lose tuition dollars when parents are unhappy with academic outcomes.
- Funding for Pennsylvania public schools jumped to almost $24,000 per student in the 2024–25 school year,[14] yet student outcomes have not improved despite the 68 percent spending increase since 2015. The PSSA 2025 results reveal 51.5 percent of kids read below grade level, with math scores showing 58.3 percent at below basic or basic.[15]
- The January 2025 release of the latest NAEP, or Nation’s Report Card, puts more than two-thirds of the commonwealth’s eighth graders as not proficient in math and reading. Pennsylvania fourth graders, at less than half proficient in either math or reading, did not do much better.[16]
- The NAEP, administered every two years, in 2022 revealed that Catholic school students excelled during the COVID-19 pandemic, while public school students lost ground.[17]
- Notably, these results underline that Pennsylvania public schools have made no measurable improvement since 2003 to close achievement gaps of more than 25 points for Black and Hispanic students, economically disadvantaged students, or English language learners.[18]
- The lack of accountability is especially evident among the state’s low-achieving public schools. Public schools that repeatedly score in the bottom 15 percent on Keystone and PSSA exams have received increased education funding, all without producing academic results.
- There are 211,000 kids across the state attending 380 district schools. Sixty-six percent (or 250) of these schools have, for seven or more years, been among Pennsylvania’s low-achieving schools, with kids trapped in a failing school for their entire elementary, middle, or high school tenure, with no hope of improvement.
- The School District of Philadelphia, at 134, has the highest number of low-achieving schools.[19]
MYTH: Pennsylvania voters do not want to participate in the FSTC.
FACT: Polling shows that Pennsylvania parents and taxpayers support the FSTC program.
- Democrats for Education Reform report that 78 percent of Keystone voters support the FSTC.[20]
- EdChoice polling indicates that 70 percent of school parents and 60 percent of American adults are in favor of the program.[21]
- Invest in Ed data shows that nearly nine-in-ten voters (88 percent) support Pennsylvania joining the program, and more than nine-in-ten, or 94 percent, agree that Shapiro needs to act now to ensure Pennsylvania participates in the FSTC.[22]
- The Commonwealth Foundation’s June 2026 polling finds 71 percent of voters support opting in to the FSTC.[23]
MYTH: The FSTC is a voucher program that takes money away from public schools.
FACT: The FSTC program doesn’t cost the state or school district one cent but would provide additional funds for Pennsylvania public and private school students.
- The FSTC funds students whether they are in a private, district, charter/cyber charter, career/technical, or microschool, as well as those who homeschool.
- Individual private donors fund the federal scholarships, and K–12 students attending all types of schools—including public—will benefit.
- Parents will apply for a scholarship through a scholarship granting organization (SGO) to receive scholarships based on family income.
- Parents of public school students can use the scholarship funds for qualified educational expenses, such as school supplies, activity fees, tutoring, books, computer equipment, arts and music enrichment, and special education expenses.
- Parents of private school students may use the funds to offset private school tuition or for the qualified expenses listed above.
MYTH: An FSTC scholarship is too small to help families pay tuition.
FACT: The donation amount is $1,700; SGOs will determine actual scholarship amounts.
- Some SGOs will provide full tuition scholarships; others will provide partial scholarships.
- SGOs will have the flexibility to direct funds towards the kids who need it most.
- Pennsylvania’s EITC program serves as a model, with data showing that scholarship recipients are from families earning between $44,000 and $78,000 annually, which is far below the income guidelines for the program of $116,055.
- The FSTC will work alongside, or “stack” with, other scholarship awards, including private scholarships, as well as with Pennsylvania’s existing tax credit scholarship programs, EITC, OSTC, and the Economically Disadvantaged Schools supplemental scholarship.
MYTH: The FSTC has a bias towards private school students.
FACT: The FSTC expands educational opportunity for almost all Pennsylvania students, regardless of the school they attend or where they live.
- More than 90 percent of Pennsylvania’s K–12 students qualify for the scholarship based on income.
- Households with incomes up to 300 percent of the median gross income level by county, as determined by the U.S. Department of Housing and Urban Development (HUD), are eligible to participate.
- Moreover, public schools can use this fundraising opportunity to supplement school district programming by providing scholarships to income-qualified students.
MYTH: The donation amount is too small to make a difference.
FACT: The FSTC is an uncapped program that will redirect donor funds to students in participating states.
- Individual donors with an IRS tax liability will be able to donate up to $1,700 through one of Pennsylvania’s established scholarship organizations, including EIOs, and receive a 100 percent, non-refundable IRS tax credit annually.
- Education Reform Now suggests that if 15 percent of Pennsylvania taxpayers participate in the first year, $484 million in donations will flow to Pennsylvania’s K–12 students. Expectations are that the FSTC will grow to more than $3.5 billion in subsequent years.[24]
- The law is permanent, without an expiration date. Donors can give year after year, providing continuous financial support to K–12 students in Pennsylvania and across the United States.
- However, if Shapiro fails to opt in, Pennsylvania will lose out on millions of dollars in tax revenue because taxpayers will take the credit by donating to programs in other states.
[1] Act of July 4, 2025, Pub. L. No. 119–21, § 70411, 139 Stat. 72, 215–218; Commonwealth Foundation, “Federal Scholarship Tax Credit,” February 23, 2026, https://commonwealthfoundation.org/research/federal-scholarship-tax-credit/.
[2] Commonwealth Foundation, “Public Schools Funding Hits Nearly $24,000 Per Student While Achievement Declines,” news release, May 11, 2026, https://commonwealthfoundation.org/2026/05/11/public-schools-funding-hits-nearly-24000-per-student-while-achievement-declines/; Pennsylvania Department of Education, Annual Financial Report (AFR) Data: Summary-Level, accessed May 11, 2026, https://www.pa.gov/agencies/education/programs-and-services/schools/grants-and-funding/school-finances/financial-data/summary-of-annual-financial-report-data/afr-data-summary-level; Pennsylvania Department of Education, Education Budget: “2026–27 Summary of State Appropriations,” February 2026, https://www.pa.gov/agencies/education/programs-and-services/schools/grants-and-funding/school-finances/education-budget.
[3] Commonwealth Foundation, “Education Landscape in Pennsylvania,” May 6, 2026, https://commonwealthfoundation.org/research/education-landscape-in-pennsylvania/; Pennsylvania Department of Education, Assessment Reporting: “2025 PSSA English Language Arts Results” and “2025 PSSA Math Results,” November 2025, https://www.pa.gov/agencies/education/data-and-reporting/assessment-reporting.
[4] Commonwealth Foundation, “Pennsylvania Public Schools: Nation’s Report Card 2024,” February 25, 2025, https://commonwealthfoundation.org/research/pennsylvania-public-schools-nations-report-card-2024/; National Center for Education Statistics, “Nation’s Report Card: 2024 Mathematics State Snapshot Report, Pennsylvania, Grade 4, Public Schools,” U.S. Department of Education: Institute of Education Sciences, January 29, 2025, https://nces.ed.gov/nationsreportcard/subject/publications/stt2024/pdf/2024219PA4.pdf.
[5] Pennsylvania Department of Education, Low Achieving Schools: “2025–26 List of Low Achieving Schools,” https://www.pa.gov/agencies/education/programs-and-services/schools/school-services/opportunity-scholarship-tax-credit-program.html. See also: Pennsylvania Department of Education, Enrollment: Enrollment Reports and Projections, accessed May 21, 2026, https://www.pa.gov/agencies/education/data-and-reporting/enrollment.
[6] Rachel Langan, “Pennsylvania’s Education Tax Credit Scholarships: How EITC Serves Children and Families in the Commonwealth, 2nd Edition” (Commonwealth Foundation, May 13, 2026), 10, 24, https://commonwealthfoundation.org/research/how-eitc-serves-children-and-families-in-the-commonwealth-2nd-edition/; U. S. Census Bureau, “American Community Survey: S1901 / Median Income by Types of Families in Pennsylvania, the Past 12 Months (in 2024 Inflation-Adjusted Dollars): Pennsylvania,” September 2025, https://data.census.gov/vizwidget?g=040XX00US42&infoSection=Income+and+Earnings.
[7] Langan, “Pennsylvania’s Education Tax Credit Scholarships: How EITC Serves Children and Families in the Commonwealth, 2nd Edition,” 8; Pennsylvania Department of Education, Education Budget: “2026–27 Summary of State Appropriations.”
[8] Langan, “Pennsylvania’s Education Tax Credit Scholarships: How EITC Serves Children and Families in the Commonwealth, 2nd Edition,” 4, 8–9, 17; Stephen Bloom, Pennsylvania House Republican Policy Committee Hearing on Educational Choice in the Commonwealth, January 23, 2026, (prepared testimony on behalf of the Commonwealth Foundation), https://commonwealthfoundation.org/research/pennsylvania-students-will-thrive-with-educational-choice/.
[9] Commonwealth Foundation, “New Poll: Pennsylvanians Reject Shapiro’s Budget, Demand More Educational Choice, and Oppose Costly Energy Mandates,” release, June 24, 2026, https://commonwealthfoundation.org/2026/06/24/new-poll-pennsylvanians-reject-shapiros-budget-2026/.
[10] Rachel Langan, “Shadow School Choice: When Public Schools Turn Students Away,” Commonwealth Foundation, March 19, 2025, https://commonwealthfoundation.org/research/shadow-school-choice-philadelphia/; Commonwealth Foundation, “Shadow School Choice: How Public Education Spending Fails Special Needs Students,” December 9, 2025, https://commonwealthfoundation.org/research/shadow-school-choice-how-public-education-spending-fails-special-needs-students/.
[11] Langan, “Pennsylvania’s Education Tax Credit Scholarships: How EITC Serves Children and Families in the Commonwealth, 2nd Edition,” 16; Pennsylvania Department of Education, Enrollment: Enrollment Reports and Projections.
[12] Private School Review, “Pennsylvania Private Schools by Tuition Cost,” accessed June 12, 2026, https://www.privateschoolreview.com/tuition-stats/pennsylvania.
[13] Danielle Farrie and Robert Kim, “Making the Grade: How Fair is School Funding in Your State?” (Education Law Center, 2025), https://edlawcenter.org/wp-content/uploads/2025/12/Making-the-Grade-2025.pdf; Clara Moore and Malia Nelson, “Revenues and Expenditures for Public Elementary and Secondary Education: School Year 2023–24 (Fiscal Year 2024)” (U.S. Department of Education: Institute of Education Sciences, April 2026), 12–13, 16–17, https://prod-ies-dm-migration.s3.us-gov-west-1.amazonaws.com/nces/asset_builder_data/2026/04/2026008_FY24NPEFS_FirstLook.pdf.
[14] Commonwealth Foundation, “Public Schools Funding Hits Nearly $24,000 Per Student”; Pennsylvania Department of Education, Annual Financial Report (AFR) Data: Summary-Level; Pennsylvania Department of Education, Education Budget: “2026–27 Summary of State Appropriations.”
[15] Commonwealth Foundation, “Education Landscape in Pennsylvania”; Pennsylvania Department of Education, Assessment Reporting: “2025 PSSA English Language Arts Results” and “2025 PSSA Math Results.”
[16] National Center for Education Statistics, “Nation’s Report Card: Pennsylvania Overview,” U.S. Department of Education: Institute of Education Sciences, January 29, 2025, https://www.nationsreportcard.gov/profiles/stateprofile/overview/pa?cti=PgTab_OT&sub=MAT&chort=1&st=MN&sfj=NP&sj=PA&year=2024R3.
[17] National Catholic Education Association, “The Nation’s Report Card Shows Catholic Schools Excelling Post-Pandemic,” news release, October 2022, https://ncea.org/NCEA/NCEA/How_We_Serve/News/Press_Releases/The_Nation_s_Report_Card_Shows_Catholic_Schools_Excelling_Post-Pandemic.aspx.
[18] Commonwealth Foundation, “Pennsylvania Public Schools: Nation’s Report Card 2024”; National Center for Education Statistics, “Nation’s Report Card: 2024 Mathematics State Snapshot Report.”
[19] Pennsylvania Department of Education, Low Achieving Schools: “2025–26 List of Low Achieving Schools.” See also: Pennsylvania Department of Education, Enrollment: Enrollment Reports and Projections.
[20] Democrats for Education Reform, “New PA Poll: 78% of Keystone State Voters Support Opting into the Federal Scholarship Tax Credit (FSTC),” November 25, 2025, https://dfer.org/2025/11/25/new-pa-poll-78-of-keystone-state-voters-support-opting-into-the-federal-scholarship-tax-credit-fstc/.
[21] Alli Aldis, “The Federal School Choice Program is Popular,” EdChoice, March 19, 2026, https://www.edchoice.org/2026-the-federal-school-choice-program-is-popular/.
[22] Wallin Opinion Research, “Nearly Nine-in-Ten Pennsylvania Voters Support Federal K–12 Tax Credit Scholarship Program,” Invest in Education, April 2026, https://investineducation.org/wp-content/uploads/2026/04/IIE-Polling-One-Pager-PA_V2-4.15.26.pdf.
[23] Commonwealth Foundation, “New Poll: Pennsylvanians Reject Shapiro’s Budget, Demand More Educational Choice.”
[24] Education Reform Now, “New Data Projects Potential $24 Billion Boost for Students Through Federal Scholarship Tax Credit Program,” December 22, 2025, https://edreformnow.org/2025/12/22/new-data-projects-potential-24-billion-boost-for-students-through-federal-tax-credit-scholarship-program-formerly-ecca/.